


Table of contents


No headings in the article.
Introduction
A cloud monitoring application is a software tool designed to monitor and manage the performance, availability, and security of cloud-based infrastructure and applications. It provides real-time insights and analytics to ensure the optimal functioning of cloud resources and helps detect and resolve issues proactively.
AWS ECR (Elastic Container Registry) and AWS EKS (Elastic Kubernetes Service) are two services provided by Amazon Web Services (AWS) that are commonly used in cloud-native application development and deployment scenarios.
AWS ECR is a fully managed container registry service that enables developers to store, manage, and deploy container images. It integrates seamlessly with other AWS services, such as AWS Elastic Beanstalk, AWS Fargate, and AWS ECS (Elastic Container Service). With ECR, developers can easily build, push, and pull container images, and ensure their availability and scalability for deployment in containerized environments.
AWS EKS, on the other hand, is a fully managed Kubernetes service that simplifies the deployment, management, and scaling of containerized applications using Kubernetes. EKS eliminates the need for managing the underlying Kubernetes infrastructure and allows developers to focus on application development and operations.
Prerequisite :
AWS Account
Programmatic access and CLI access to AWS
Python
Docker and kubectl
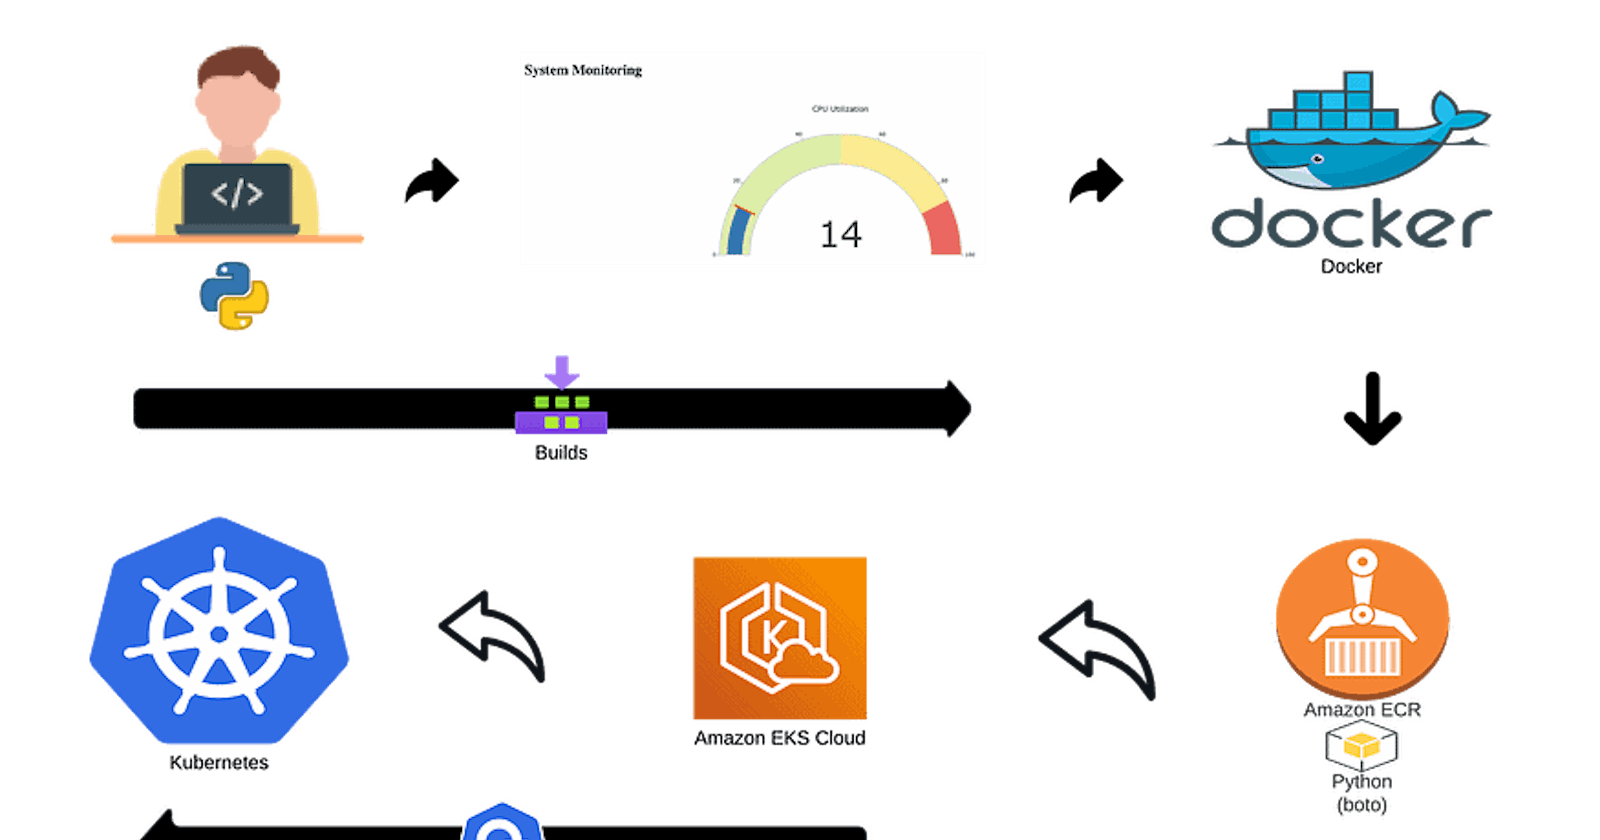
Architecture of Project
Setups to create and deploy the above architecture
Setup 1 :
Create a Project on local env and create the Flask app
import psutil
from flask import Flask, render_template
app = Flask(__name__)
@app.route("/")
def index():
cpu_metric = psutil.cpu_percent()
mem_metric = psutil.virtual_memory().percent
Message = None
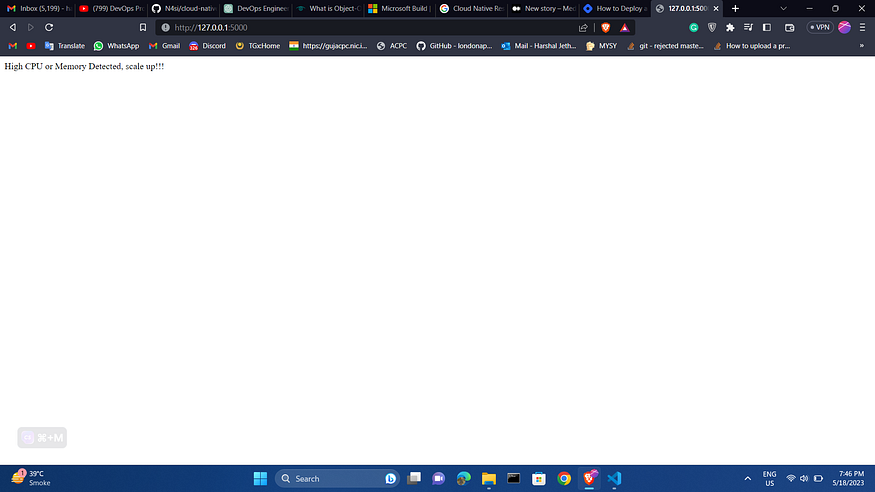
if cpu_metric > 80 or mem_metric > 80:
Message = "High CPU or Memory Detected, scale up!!!"
return render_template("index.html", cpu_metric=cpu_metric, mem_metric=mem_metric, message=Message)
if __name__=='__main__':
app.run(debug=True, host = '0.0.0.0')
Run the app locally by running the below command
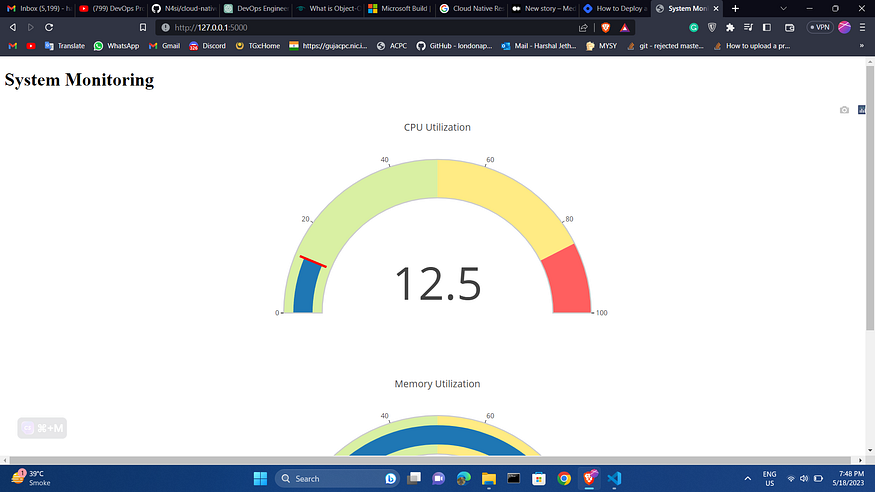
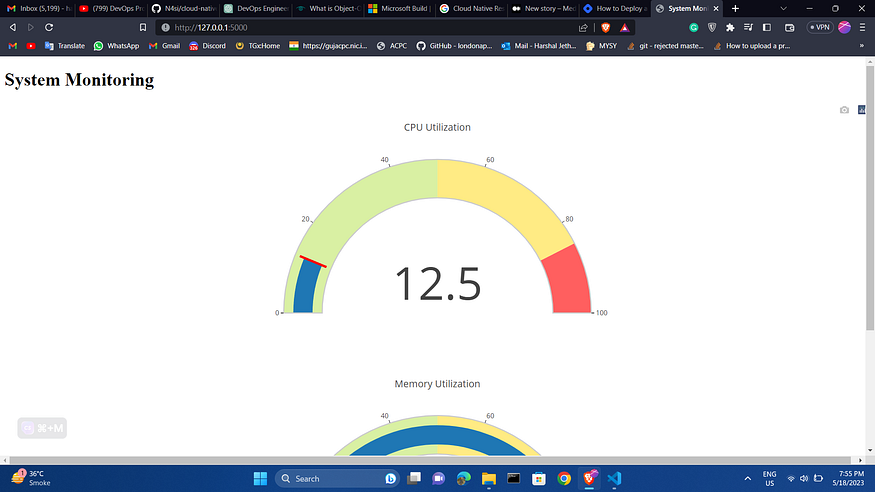
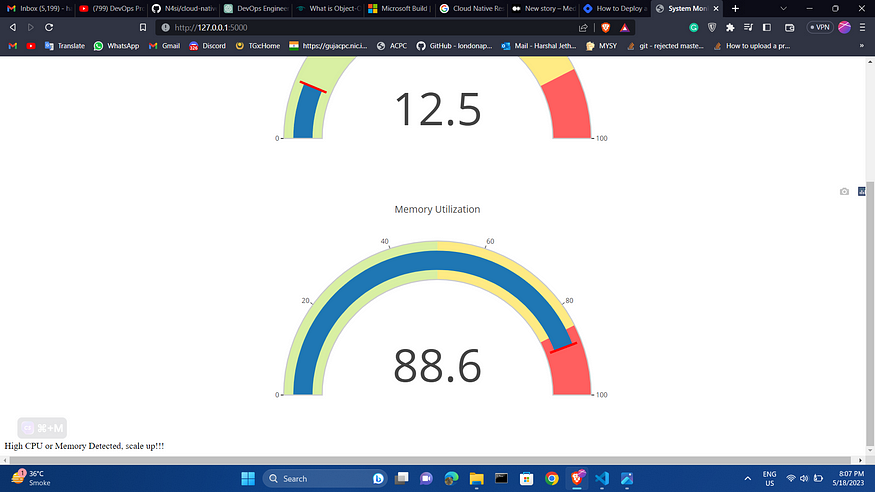
This will start the Flask development server and you can access the application by opening a web browser and navigating to http://localhost:5000/
Create Folder ‘templates’ and a file inside the folder ‘index.html’ with the codes below:
<!DOCTYPE html>
<html>
<head>
    <title>System Monitoring</title>
    <script src="https://cdn.plot.ly/plotly-latest.min.js"></script>
    <style>
        .plotly-graph-div {
            margin: auto;
            width: 50%;
            background-color: rgba(151, 128, 128, 0.688);
            padding: 20px;
        }
    </style>
</head>
<body>
    <div class="container">
        <h1>System Monitoring</h1>
        <div id="cpu-gauge"></div>
        <div id="mem-gauge"></div>
        {% if message %}
        <div class="alert alert-danger">{{ message }}</div>
        {% endif %}
    </div>
    <script>
        var cpuGauge = {
            type: "indicator",
            mode: "gauge+number",
            value: {{ cpu_metric }},
            gauge: {
                axis: { range: [null, 100] },
                bar: { color: "#1f77b4" },
                bgcolor: "white",
                borderwidth: 2,
                bordercolor: "#ccc",
                steps: [
                    { range: [0, 50], color: "#d9f0a3" },
                    { range: [50, 85], color: "#ffeb84" },
                    { range: [85, 100], color: "#ff5f5f" }
                ],
                threshold: {
                    line: { color: "red", width: 4 },
                    thickness: 0.75,
                    value: {{ cpu_metric }}
                }
            }
        };

        var memGauge = {
            type: "indicator",
            mode: "gauge+number",
            value: {{ mem_metric }},
            gauge: {
                axis: { range: [null, 100] },
                bar: { color: "#1f77b4" },
                bgcolor: "white",
                borderwidth: 2,
                bordercolor: "#ccc",
                steps: [
                    { range: [0, 50], color: "#d9f0a3" },
                    { range: [50, 85], color: "#ffeb84" },
                    { range: [85, 100], color: "#ff5f5f" }
                ],
                threshold: {
                    line: { color: "red", width: 4 },
                    thickness: 0.75,
                    value: {{ mem_metric }}
                }
            }
        };

        var cpuGaugeLayout = { title: "CPU Utilization" };
        var memGaugeLayout = { title: "Memory Utilization" };

        Plotly.newPlot('cpu-gauge', [cpuGauge], cpuGaugeLayout);
        Plotly.newPlot('mem-gauge', [memGauge], memGaugeLayout);
    </script>
</body>
</html>
Setup 2:
Containerize the application using Docker
Create a new file in the same directory as app.py name it requirements.txt. These are the dependency libraries and appropriate versions that are required to be used for the project.
Flask==2.2.3
MarkupSafe==2.1.2
Werkzeug==2.2.3
itsdangerous==2.1.2
psutil==5.8.0
plotly==5.5.0
tenacity==8.0.1
boto3==1.26.63
kubernetes==10.0.1
Now, we will create Dockerfile. Create Dockerfile and paste the below code
FROM python:3.9-slim-buster
WORKDIR /app
COPY requirement.txt .
RUN pip3 install --no-cache -r requirement.txt
COPY . .
ENV FLASK_RUN_HOST=0.0.0.0
EXPOSE 5000
CMD ["flask", "run"]
To build the Docker image, run the following command in the same directory as the Dockerfile:
Docker build -t cloud-monitoring .
This will build a Docker image with the tag cloud-monitoring.
To run the Docker container from the image, run the following command:
docker run -d -p 5000:5000 cloud-monitoring
This command starts a Docker container and maps port 5000 on the host to port 5000 on the container. The command ‘-d’ also runs the container in a detached mode.
Open a web browser and navigate to http://localhost:5000 to see the render_template HTML output:
Setup 3:
Create ECR and push the image to the Repo
First, create the file on the local env project folder called ecr.py
ecr_client = boto3.client('ecr')
repository_name = "cloud_monitoring_app"
response = ecr_client.create_repository(repositoryName=repository_name)
repository_uri = response ['repository']['repositoryUri']
print(repository_uri)
you can use the AWS CLI to create an Amazon ECR repository and push the Docker image to the repository.
First, create an ECR repository by running the following command:
aws ecr create-repository — repository-name cloud_monitoring_app
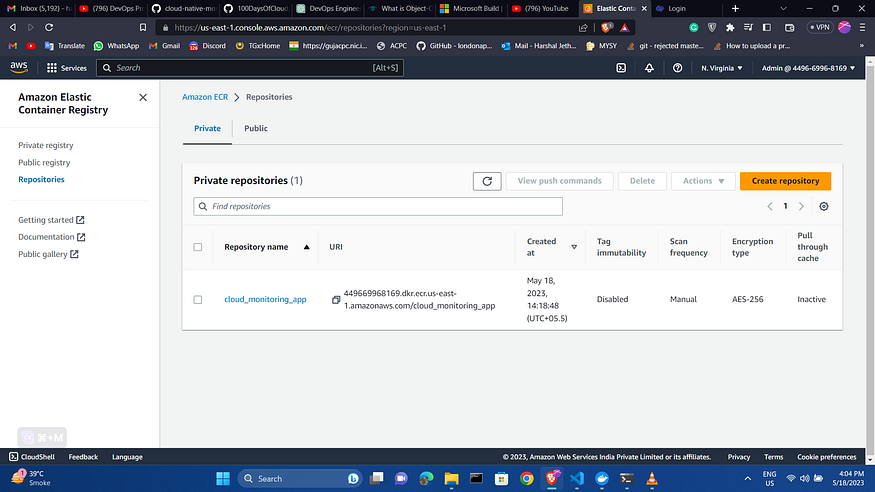
The next step is to access the AWS management console and search for “ECR” in the search bar to navigate to the Elastic Container Registry. Once there, you can view the recently created repository.
To push the Docker image that was created on your local machine to the AWS ECR Repository, click on “View Push Commands” to get instructions on how to proceed. Follow the instructions to complete the image push.
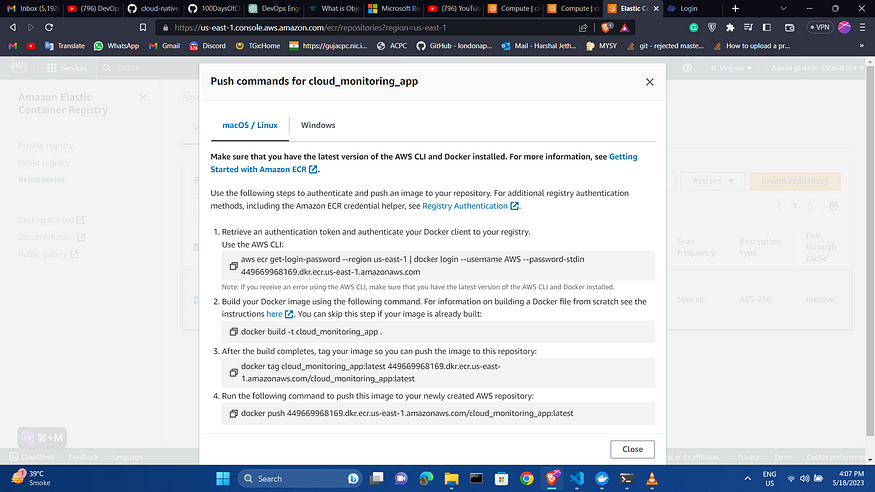
And then run the above-given command on your cmd.
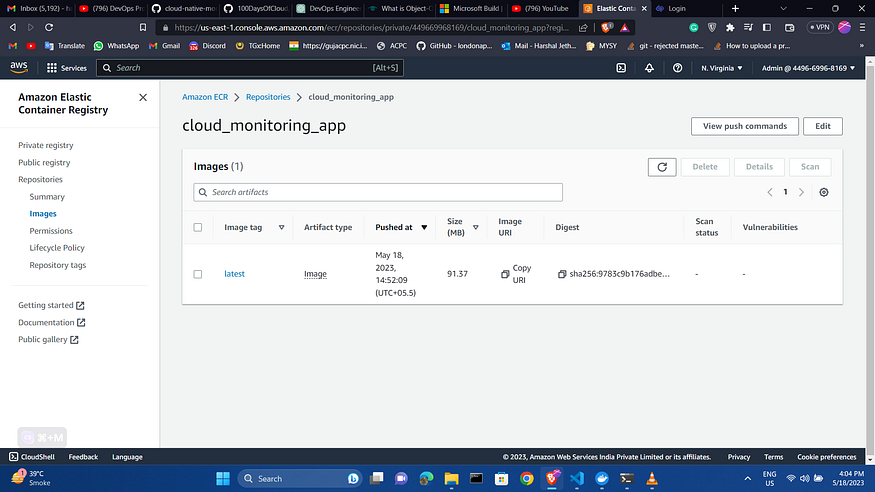
after executing the above command the ECR repo will look like this
Setup 4:
Create Kubernetes Deployment and Service file on your local project Env.
create a Kubernetes Deployment and Service that use the cloud-monitoring Docker image.
Create a new file in the same directory and name it eck.py.
from kubernetes import client, config
config.load_kube_config()
api_client = client.ApiClient()
deployment = client.V1Deployment(
    metadata=client.V1ObjectMeta(name="my-monitoring-app"),
    spec=client.V1DeploymentSpec(
        replicas=1,
        selector=client.V1LabelSelector(
            match_labels={"app": "my-monitoring-app"}
        ),
        template=client.V1PodTemplateSpec(
            metadata=client.V1ObjectMeta(
                labels={"app": "my-monitoring-app"}
            ),
            spec=client.V1PodSpec(
                containers=[
                    client.V1Container(
                        name="my-monitoring-container",
                        image="449669968169.dkr.ecr.us-east-1.amazonaws.com/cloud_monitoring_app:latest",
                        ports=[client.V1ContainerPort(container_port=5000)]
                    )]
            ))
    ))
api_instance = client.AppsV1Api(api_client)
api_instance.create_namespaced_deployment(
    namespace="default",
    body=deployment
)
service = client.V1Service(
    metadata=client.V1ObjectMeta(name="my-monitoring-service"),
    spec=client.V1ServiceSpec(
        selector={"app": "my-monitoring-app"},
        ports=[client.V1ServicePort(port=5000)]
    ))

api_instance = client.CoreV1Api(api_client)
api_instance.create_namespaced_service(
    namespace="default",
    body=service
)
This Python code is for deploying a Flask application on a Kubernetes cluster.
Firstly, the code imports the required Kubernetes client and configuration modules from the Kubernetes Python library.
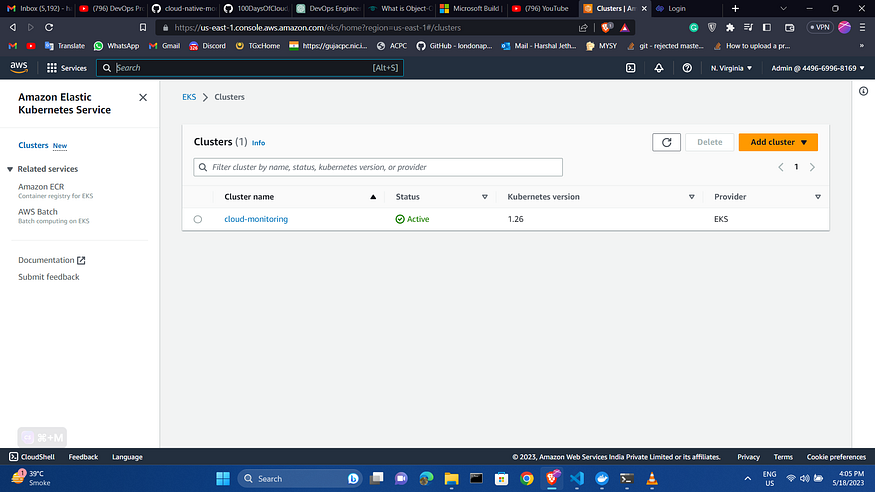
now we will create two nodes in this eks cluster
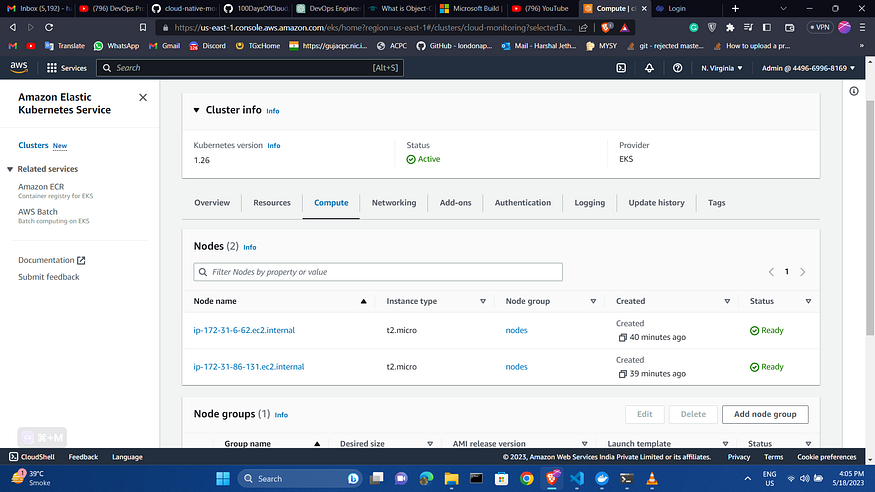
To apply these Kubernetes manifests, run the following command:
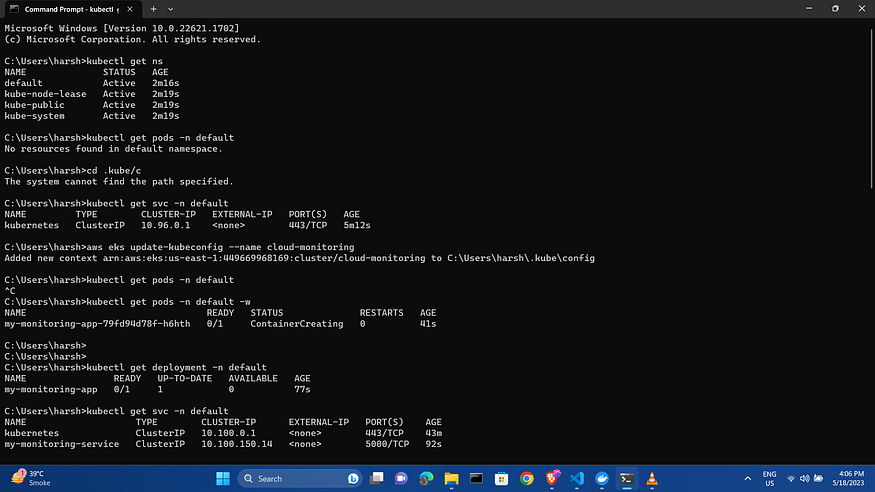
Confirm the deployment service my running
kubectl get deployment -n default
kubectl get svc -n default
Setup 6:
Port forward and expose the Kubernetes application
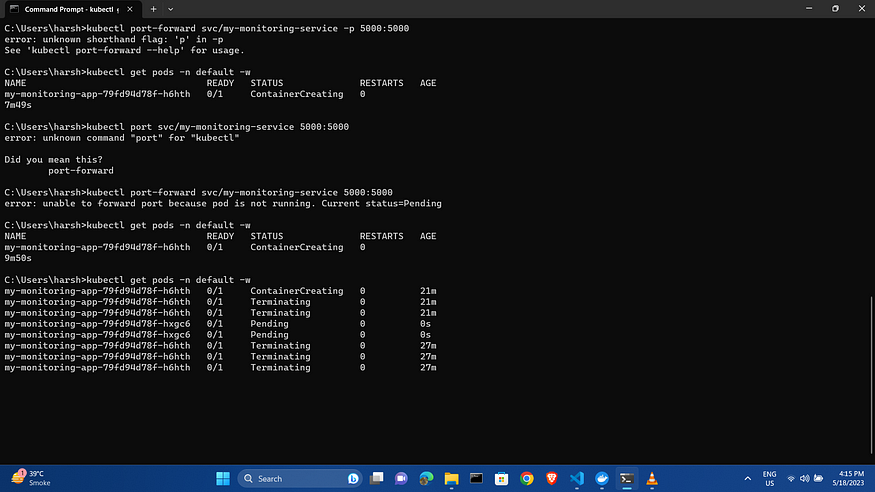
To access the Kubernetes application from your local machine, you need to forward the Kubernetes Service port to your local machine.
kubectl port-forward svc/my-monitoring-service 5000:5000
You can now access the my-monitoring-app application by opening a web browser and navigating to http://localhost:5000/.
For the code of this project check out my GitHub repo
https://github.com/HARSHALJETHWA19/Cloud-Monitoring-Application
Follow me :
Linkedin: https://www.linkedin.com/in/harshaljethwa/
GitHub: https://github.com/HARSHALJETHWA19/
Twitter: https://twitter.com/harshaljethwaa
Thank You!!!